Radio producer Julia Drapkin was tired of climate reporting. Not of the subject itself, but of the routine, which she found lacking: First, a scientist must pose a question, conduct research, and eventually publish. Only then can a reporter write a story, maybe interview the scientist, and maybe—if she has time, which she rarely does—find “a local anecdote to make the story familiar.”
“That wasn’t working anymore. It never really did,” Drapkin told Civicist.
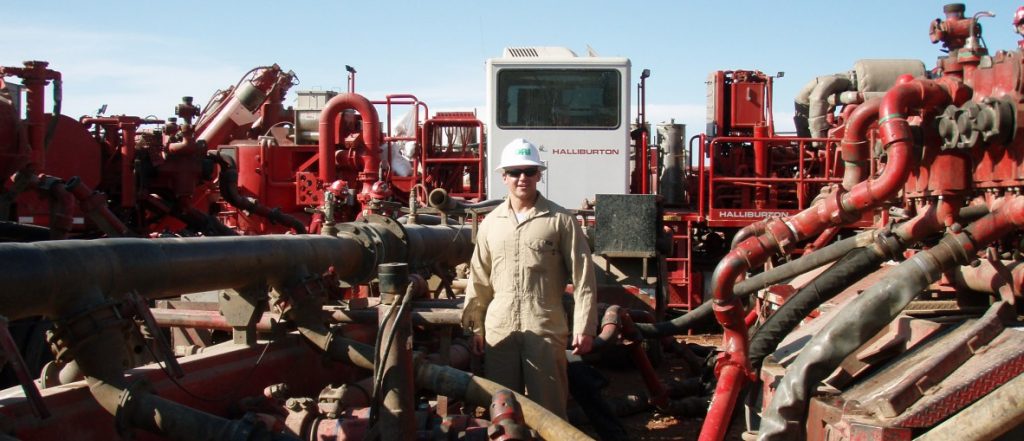
Drapkin wanted to turn that model on its head, to put the local anecdote at the heart of climate reporting. The project she proposed and eventually secured funding for in 2012 became iSeeChange: a citizen-science-slash-journalism project that relaunched last year with a new website, optimized for mobile, and expanded coverage nationwide. The project also received an institutional stamp of approval in the form of a new partnership with NASA’s Jet Propulsion Laboratory, in addition to partnerships with the Berkeley Atmospheric CO2 Observation Network (BEACO2N) and Yale Climate Connections, and with numerous radio stations around the country.
EXPERTS IN THEIR OWN BACKYARD
In 2012, Drapkin’s proposal was selected by the Association for Independence in Radio (AIR) to be part of the inaugural year of the Localore initiative, a program to support innovation in locally-produced public media. As a condition of the year-long grant, Drapkin moved from New Orleans to western Colorado to lead the iSeeChange pilot at community radio station KVNF-FM in Paonia.
She started simply, by going on air and asking the audience what they were seeing change that season.
“We just started getting these phenomenal tips,” Drapkin said. “They tipped us off to the earliest spring [on record] in the history of the United States; they started talking about wildfires and droughts two months, three months in advance of mainstream news…we were talking about West Nile Virus early.”
In many ways, that first year was a proof of concept, all before they even got a website up and running.
“People are experts in their own backyard,” Drapkin said. “We underestimate people’s ability to flag things that are really significant. And if we provide a platform on which people can do that, that’s really important.”
The first iSeeChange website, The Almanac, launched in February 2013. Posts could be viewed by week, by season, or by year, and the website’s whimsical header photo evoked the old-time feel of the weather-forecasting periodical, the Farmers’ Almanac.

While developing the iSeeChange model, Drapkin also discovered a longstanding tradition of note-keeping in the small Colorado community that dated back to the Dust Bowl, at least.
“They read like tweets from the 1920s and 30s,” Drapkin said of the daily diary entries of farmers like William Beezley. “And you could see that these were climate records…notes from the last major, man-made environmental crisis, the Dust Bowl, [and] you could see the parallels between that time and 2012 happening in near-real-time. It was mind-blowing.”
Drapkin believes that iSeeChange is as important a resource for future generations as it is for ours, and that it is a weather-forecasting tool as well as a historical record.
“We need to write everything down so that this generation can have a record to pass onto the next, so that we have a baseline to be able to really gauge change,” she said.

Not just record-highs and record-lows, she adds, but “how we are impacted…because you can’t record that from a weather station.”
A month after the website launched Drapkin’s Localore funding ran out.
ISEECHANGE IN LIMBO
Without funding, Drapkin had to move back to New Orleans and iSeeChange fell into a lull. KVNF kept the project going in that little corner of Colorado, but the project had otherwise stalled.
“People kept using it [the website], but nobody was answering them,” Drapkin explained. “I couldn’t scale myself without any additional resources.”
In spite of her success in Paonia and even a feature on This American Life, Drapkin had trouble finding new funding. “It was like crickets,” she said.
In the course of hustling for grants or other opportunities for iSeeChange, Drapkin was invited to speak at both NASA headquarters and the NASA Jet Propulsion Laboratory (JPL), and something clicked.
“I said, we at iSeeChange, in this community, we’re near-sensing,” Drapkin told Civicist. “You guys [at NASA JPL] are remote-sensing. How do we connect the dots?”
In October 2013, iSeeChange and NASA held a workshop on tackling the challenges and opportunities of citizen science, and how to better connect the scientific community with the general public. The workshop led to a partnership with NASA JPL and a new mission: to integrate satellite data on atmospheric carbon dioxide levels into a new iSeeChange platform.
In late 2014, Drapkin finally secured new funding from AIR to scale the iSeeChange model nationwide and began gearing up for the relaunch.
OBSERVATION AND DATA, SIDE BY SIDE
Several months earlier, in July 2014, NASA had launched its first satellite dedicated to measuring levels of atmospheric carbon dioxide, the Orbiting Carbon Observatory-2 (OCO-2). (The original Orbiting Carbon Observatory crashed into the ocean near Antartica minutes after launching in February 2009, when the payload fairing failed to separate, preventing the satellite from making orbit.)
Data supplied by OCO-2 will help identify and characterize sources and sinks (absorption sites) of atmospheric carbon dioxide, and to quantify carbon dioxide variability over the seasons. And now, through the partnership between NASA JPL and iSeeChange, OCO-2 data will add context to crowdsourced climate observations, and vice versa. Geotagged posts on the new iSeeChange website include temperature and other statistics, including humidity, wind speed, and visibility, as well as the level of atmospheric carbon dioxide in the area.
 For example, when Eliot Walter posted a photo of a mosquito taken on December 30 in Lexington, Kentucky, the iSeeChange website filled in a 7:14:24 pm reading from forecast.io, and a carbon dioxide reading of 403.70 ppm, which had been recorded 93 miles away on November 10. (Atmospheric carbon dioxide only surpassed 400 ppm in 2013, a first since scientists began keeping track in 1958.)
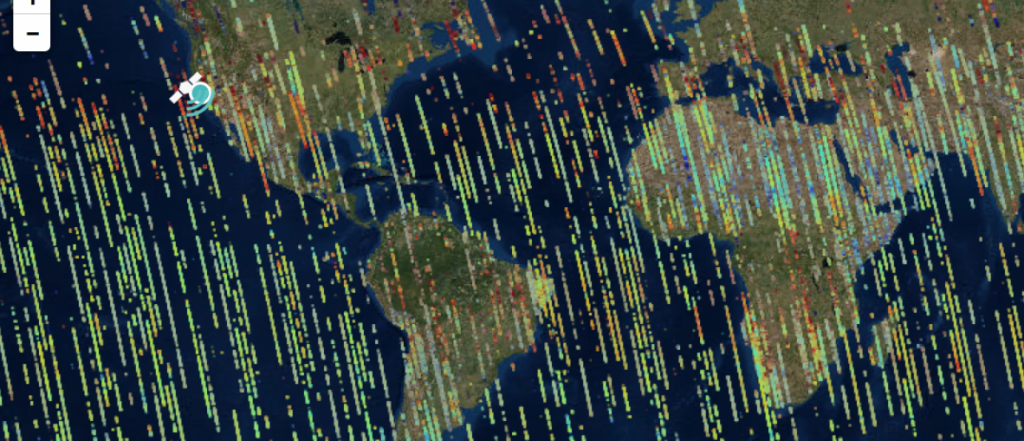
Because of the nature of a satellite, NASA does not have a constant, complete picture of atmospheric carbon dioxide. Instead, they get “skinny swaths of data,” the science data applications lead for OCO-2, Karen Yuen, explained to Civicist.
OCO-2 makes 14.5 orbits of the earth a day but the spectrometer used to take measurements must be focused very tightly on a small area, which limits coverage—that’s why the closest carbon dioxide reading for an iSeeChange post could be almost 100 miles away. On top of that, measurements can’t be taken through cloud cover. “Every day we make about a million measurements but only keep 100,000 of them because of the clouds,” Yuen said.
NASA estimates that they get a “complete” picture of global carbon every 16 days, Yuen tells Civicist.
When you zoom out on one of the carbon dioxide maps on iSeeChange, you see what Yuen means by skinny swaths of data.

But with computer modeling, NASA can do impressive things with that data, including produce short videos like “A Year in the Life of Earth’s CO2.”
MAKING THE INVISIBLE, VISIBLE
“When we started we didn’t know exactly what we were going to be able to do with the data, we had just this basic idea of syncing the data with posts,” Drapkin told Civicist.
“The trick is that CO2 is an invisible gas,” Karen Yuen explained. “Short of providing micro-sensors to people, how else can we get people to want to participate in a citizen science project with us where they cannot see the gas? Well, what we can ask people to do is report out what they can see and feel from the ground. By noting changes from the ground such as early bloom, increased dust, temperature, taking a picture of something unusual, the citizen scientist is helping to create their own regional database every time anyone uploads information.”
“If you take the iSeeChange data about how weather and climate change are impacting your daily life and juxtapose it with carbon, we are telling a story about climate change in a very new and different way,” Drapkin said.
Yuen said that citizen science is an ongoing pitch of hers at NASA. Generally speaking, she said, those in management are often fans of the idea but worry about backing a project that seems out of their control. Scientists are an equally hard sell, she said, fretting over whether the information will be up to their standards.
“What I told them was that’s not the point,” Yuen said. “Something is better than nothing…when people point out areas where they say ‘we noticed something different, you guys should look at that,’ that’s like a needle in a haystack. That’s really important.”
The new iSeeChange website has a feature for precisely that: a button that allows users to flag posts as “weird” and worthy of additional scrutiny and investigation.
Even without the needle-in-the-haystack observations, or the climate change narrative that could emerge from the juxtaposition of data and observation, the partnership will get this particular data set in front of more eyes, which is one of NASA’s organizational goals: to “reveal the unknown for the benefit of humankind.”
LOOKING FOR LEGITIMACY
Citizen science is far from new. In the mid-18th century, for example, a Norwegian bishop called upon a network of clergymen to keep him in observations of and specimens from the natural world. However, the decreasing cost of tools and sensors, not to mention the proliferation of mini-computers that many of us carry around all day, every day, has allowed citizen science to flourish to an unprecedented extent.
In 2007, the public helped classify the shapes of one million galaxies in only three weeks as part of a project called Galaxy Zoo. Before Galaxy Zoo launched, astronomers had estimated that it would take experts three to five years to complete the task.
Lucy Fortson, one of the co-founders of the Citizen Science Alliance (CSA), which oversees Galaxy Zoo and the other projects that populate the citizen-science platform Zooniverse, believes that citizen-science projects should have the capacity to produce peer-reviewed science. Galaxy Zoo was among the earliest citizen-science projects to do so. Since then, CSA projects have resulted in nearly 50 articles that have appeared in peer-reviewed journals.
But Galaxy Zoo is data analysis, not data collection. Every classification is agreed upon by consensus, involving at least 20 individuals.
The challenge with projects like iSeeChange, Fortson explained, is substantiating observations with additional data.“The difficulty is if you have someone who could be an expert,” she said, “who could say ‘We’ve never have a second crop of raspberries.’”
But that just doesn’t carry the same weight as 20 people saying, “I had a second crop of raspberries, too.”
However, Fortson is also familiar with the power of the crowd to find anomalies in a large data set. When CSA created an online forum where citizen scientists could discuss their work with project scientists and with each other, volunteers began making discoveries of their own.
“Unlike a machine, a human can say, ‘Ooh, that looks really weird’ and post about it on the forum,” Fortson said. That’s how a group of volunteers discovered what has been dubbed the “Green Pea” galaxies, for their small size and bright green color.
Her words recall those of both Karen Yuen and Julia Drapkin, explaining the reasoning behind iSeeChange.
A NEW CITIZEN SCIENCE
ISeeChange does not fit in the clearly defined box of citizen science that Galaxy Zoo belongs to, but its not the first to break down barriers between disciplines, either.
Jeffrey Warren, one of the co-founders of the Public Lab, a nonprofit dedicated to democratizing science in the pursuit of environmental justice, draws a distinction between citizen science and community science. He sees the first as being primarily concerned with getting people to submit data or to perform a simple task, like identifying a type of galaxy or a species of animal.
He defines community science, on the other hand, as the engagement of the public at all levels of the scientific process.
“We typically don’t call ourselves a citizen science organization,” Public Lab executive director Shannon Dosemagen told techPresident in 2014. “We don’t want to be…posing research questions and then telling people to give us data…We work way outside of what the normal scope of that is.”
The same could be said of Drapkin’s iSeeChange: an entirely people-powered platform, without an explicit research question other than, “Hey guys, what’s new? What’s different?”
One thing that’s more challenging with this broader, squishier kind of citizen science is that it is harder to prove “success.” Lucy Fortson can point to nearly 50 peer-reviewed articles and say “That’s what we’ve accomplished,” but with Public Lab projects or iSeeChange, those metrics are less defined.
Warren told Civicist that early on—Public Lab was created in 2011—they measured success by participation and engagement.
“Now we’re more mature, people are more interested in outcomes—measurable impacts on the world,” Warren said. “[For example], data being used in legal proceedings, [and] regulatory outcomes.” But even if they have some concrete successes, there are reverberating impacts that are nearly impossible to measure, like changes in perception, “corporations…the EPA, or politicians [becoming] more aware of people’s ability to organize and collect data.”
ISeeChange declined to share contributor numbers, but even if they had, the absolute reach of the project would be similarly hard to quantify, because it would include radio listeners and random social media users. (Some stations, in the early years, didn’t require listeners to post on The Almanac website and instead had them submit observations on Twitter or Facebook using the hashtag #iSeeChange, which Drapkin said they at one point shared with a weight-loss program.)
Drapkin can point to the numerous radio stories that iSeeChange has inspired, but the impact of those stories is hard to measure. Karen Yuen would like people to be inspired by the project to make changes in their daily lives, to drive less or not to not rely so heavily on their air conditioner. Yuen told Civicist that NASA will at some point publish a report on the project, detailing what worked, what didn’t work, and best practices for future collaborations of a similar nature.
The advantage of the dual citizen-science, citizen-journalism qualities of iSeeChange is the built-in broadcast component guaranteed to spread the word far and wide.
Now to see who heeds their call, and what they can all accomplish.